Down our first rabbit hole!
I think one of the most important characteristics of a good system developer is curiosity. That's because there are so many different rocks that we stumble onto when we are building systems, and you really have to be willing to put forth the energy and start looking under them, for no other reason than to just see what is there. In the case of this thread, everything I've bolded in red font represents a potential improvement to the core method. One person just doesn't have the time and energy to look at all of them, which is why I don't go through each one, but if I see a tempting rock, I'm still willing to take a peek. So that's what I did with our Spherical function, and whoops, I found a rabbit hole under that rock! You can officially consider this thread having gone of the rails, as this is all new territory for me, and it looks like we're going to end up in a different place than my original intention with this script...
Anyway, I got to thinking about the aspects in the spherical function we build in Buttonwood_v2, and thought I should take a closer look at them. So what I did was run the optimizer over everything from 0 to 180 in steps of 1 degree. Technically, these aren't degrees, since the aspects are actually measured as ratios of the distance to the planets compared to the diameter of the celestial sphere, which is completely different. But to keep it in terms that everyone can easily understand and relate to (including myself), I transform those values into the range of 0 to 180, so it all works out like regular old planetary aspects. But just so you know, this is much more complicated than what the other astrologers are working with. Going from 2D to 3D is a big deal, and there's a reason why Gann had two full time professional astrologers on the payroll, figuring all this stuff out and doing calculations for him.
Once the optimizer was done, we can build a chart in Excel to show the results in a visual way, which is easier to look at than before. This is the result of running Buttonwood_v2, but with the filter only building the weather index one degree at a time. So if we set the degree to "30", it will only trade on days when there are lots of 30 degree hits from the current planets to the natal, measured using spherical astro.
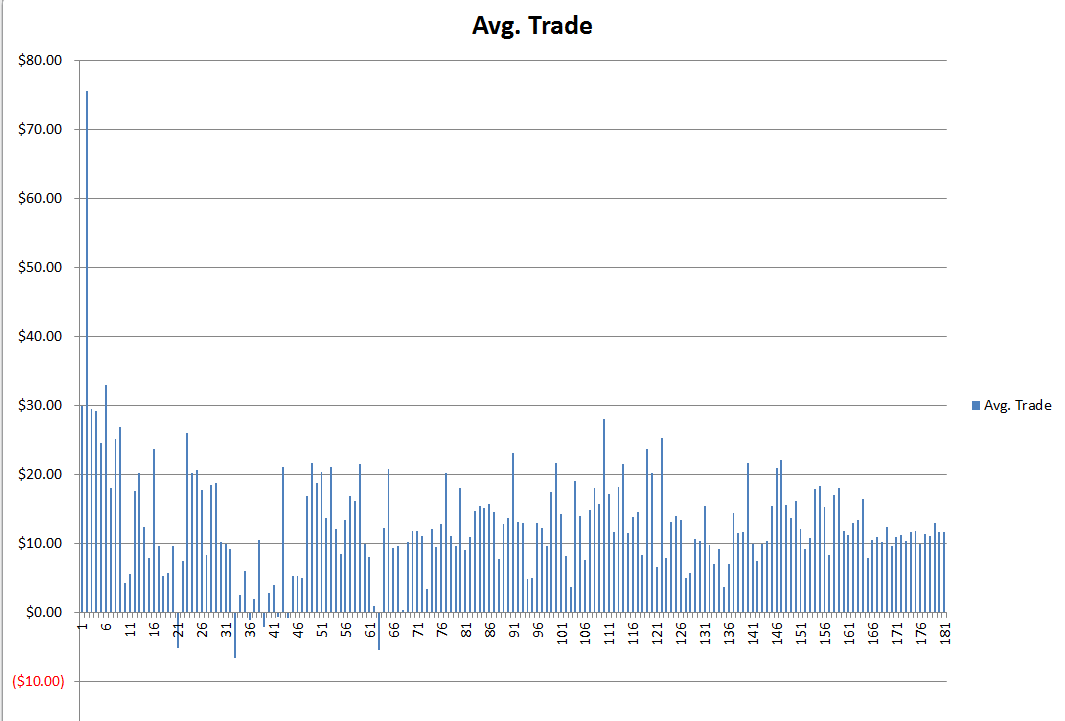
- Average Trade by Degree
- avg_trade_spherical.png (13.7 KiB) Viewed 51737 times
This is what that looks like. The vertical axis is average trade value, and the horizontal axis is the degree value used in our spherical filter. This shows what our system looked like when run on every possible degree selection in the market weather forecast. In order to make this a little easier to look at, I replaced the value at degree=0 with $30, because it was $375 and ended up squashing everyone else. You can make out some peaks and troughs, but it's noisy. Let's smooth this out, by averaging each point with its nearest neighbors. So the new value for point 30 is actually (point 29 + point 30 + point 31)/3. Do it once, then do it again to make it even smoother, and this is what you get:
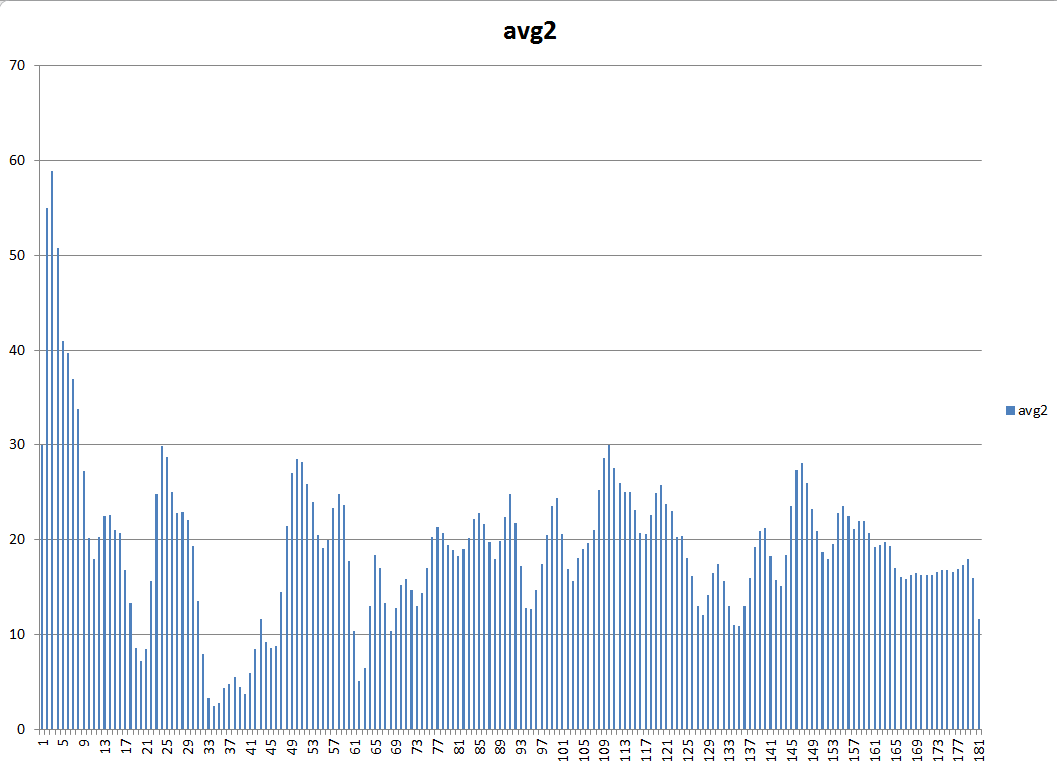
- A little smoother, please
- avg_trade_spherical2.png (11.02 KiB) Viewed 51737 times
Just to make sure everyone is on the same page here, let me take a step back and take a minute to explain again what we're looking at. Basically, we are trying to find big days in the ES, because those days are the easiest to trade. So what we did was build a trend-following system, and we are only running it at selected times, according to the "weather" filters we are working on. We then study the average trade value from the system reports. When the average trade value is high, it means that the system is doing well, and making lots of money. When the average trade value is low, it means the system is struggling, and not making as much money. So the average trade value is a representation of market volatility. We could try and measure market volatility directly, and there are ways to do that, but we are more interested in making money than forecasting volatility, so it actually makes a lot more sense to measure volatility as the success of a trend following system instead. So that's why we like high average trade values, and are using that in order to build our weather functions. If we can figure out what days moving averages work well, then we'll be able to make money using all the other trend following technical indicators as well, because if moving averages work, then they will too. Make sense?
Coming back to this last chart, you can see that the average trade value does really well towards zero. It then cycles out, losing performance as we get towards 33 degrees, then gaining it back towards 53, etc. You'll notice that I'm writing this post on a Saturday. That's because I got all excited about that chart last night, and saw a cycle there. Check it out:
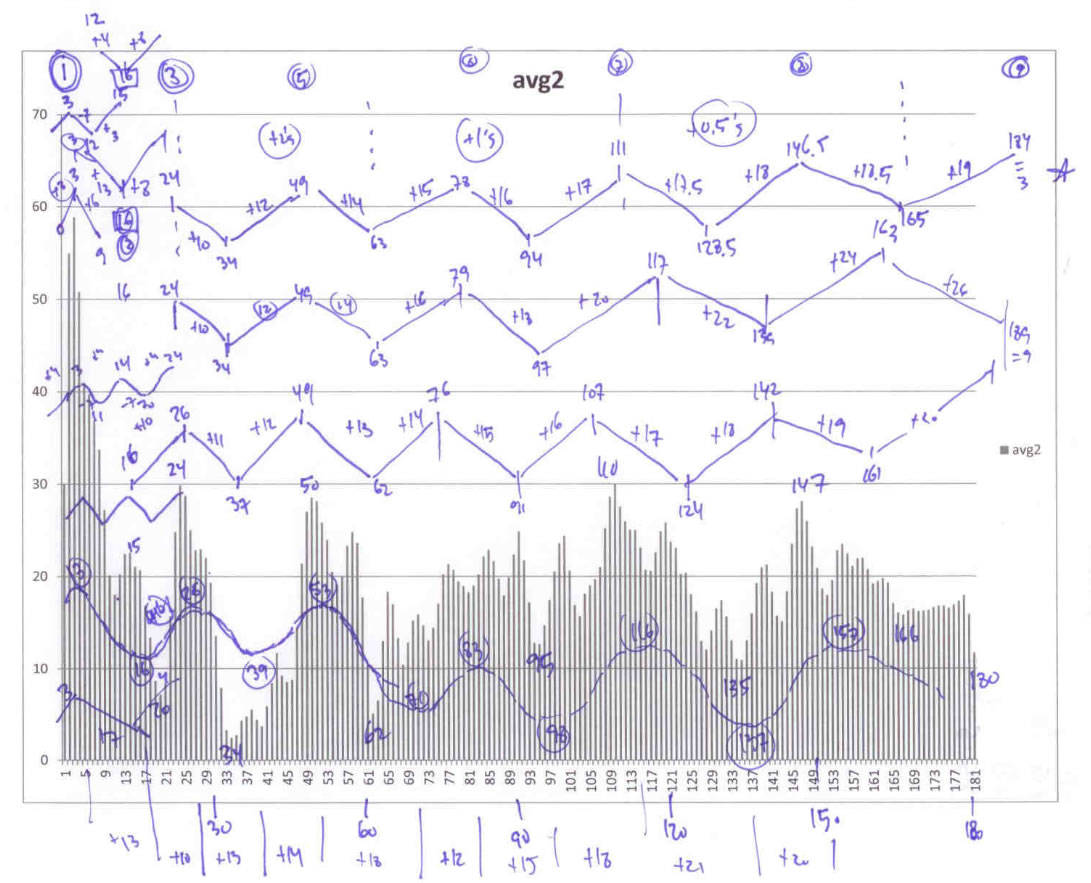
- Secrets of the Universe, or Shapes in the Clouds?
- looking_for_cycles1.jpg (144.46 KiB) Viewed 51737 times
A little messy, but it's a worksheet. Remember those IQ tests they used to make you take back in high school? The solution (top line) reminded me of that. Basically, start off with a small cycle, then each new wave adds a fixed amount. So at point 3 at the top, we're at 24 degrees. The next point is 10 degrees forward to a low at 34, then increment by 2, which gives us 10+2=12, and add 12 to 34 to get the next high point at 49. We incremented by 12 last time, so add 2 again to get 14, and then move forward that amount from 49, to 63, which is the next low point. As we move forward, we increment each additional time, making swings that are larger and larger. The increment value then starts decreasing, from +2, to +1, then to +0.5. So it's all nice and regular, and the final swing wraps around to 184 degrees, which reduces back to 4, giving us the peak at the first part of the chart. Anyway, if it's not totally clear, that's ok. Just showing what I was working on here - a very regular, very predictable cycle that describes the ebb and flow in the volatility cycle we've been looking at. Cool stuff.
Everything in our galaxy is thought to orbit around a big black hole, at the very center. That black hole is so big and strong that entire galaxies orbit around it, just like the Earth orbits around the Sun. As you get closer to the center of the black hole, the gravitational force gets stronger, so the stars located there have to move faster in order to avoid getting sucked into the hole. That's actually how astronomers figured out there was a black hole there - the nearest stars were moving at crazy fast speeds, flying around it. Then, as you move out, everything slows down. It's the same in our solar system - Mercury goes around the Sun faster the Venus, which goes faster than the Earth, etc.
Anyway, that's what this reminds me of. Sort of a Kepler's Laws of Planetary Motion, but for markets. The highest energy is located at 0 degrees, which is a spherical conjunction. You know it's the most powerful aspect because you can see the huge spike in average trade value there. Then, as we move out, we do so in waves, reducing our average trade, then increasing it, etc. The farther we get from zero, the slower the waves move, and the closer we get to zero, the faster they move. So here we are, messing around with filters and mechanical systems, and the next thing you know we're talking about secrets of the Universe. That's Wave59 for you. LOL
Let me also just take a moment and point out that there at 10 points here, starting with a high just after the zero point. If you've bought the Bertha book, that's going to get you excited, as the Kepler piece has some really interesting implications to those techniques. If you haven't read the Bertha book, just ignore that comment and don't worry about it. If you have read the Bertha book, but didn't actually buy it, well, then no cookie for you either way - Santa's going to put a lump of coal in your stocking this year.
So you can see why I was up messing around with this last night, and why I was excited enough to get in here on Saturday and do some more work on this. It's interesting stuff, and forecasting volatility is no small trick. If we could forecast daily volatility accurately, as far ahead of time as we wanted, we'd basically be able to print money in the options market.

However, now that we're here, it's good to take a step back and remember what we are doing, and that we've been running down a rabbit hole. We're in the middle of building a day trading system, and need to make some decisions. What are we going to do with this information as far as our daytrading system goes?
As much as I like the pattern that I stumbled on to, and as much as I'm drawn to solving markets in a more large scale theoretical way, there are some issues. First, there's a little bit of a "curve fitting" feeling I've got, working all of this out. Yeah, it makes theoretical sense, and it's very cool, but we used the 2009-2015 data to solve for this volatility cycle, so if we implement it in a very complicated and detailed way, it will obviously do really well from 2009-2015, but how will it do in 2016? Do I really trust all those minor cycle highs and lows towards 180? It's the complexity that has got me a little worried. Part of building systems is data mining, and there's no way around that, but there's a point where you've got to realize that the model is getting a little too involved, and I'm there with this particular approach. It might be the holy grail, but I'm not trying to solve for that right now - I'm just trying to build a reliable system. So I'm not going to forget that I saw this, and will come back to it later, but I'm going to see if maybe there's a way to just simplify a little and consider robustness over perfection.
In other words, we've got this data, so what's the most obvious, in-your-face sort of thing it is telling us? Yes, the cycle is there, but even more blatant than that is that the average trade value is really skewed towards zero. What if we focus on that? In other words, rather than worrying about how all those stars orbit around the black hole, why don't we just focus on the black hole itself. Let's go to where the odds are completely in our favor.
That means building a revised spherical filter, which I'll do next. Climbing back out of the rabbit hole....
Earik