Introducing our Weather Forecasting function and building Buttonwood_v1
We now have everything we need in order to build a working system except for our market weather forecasting function, which I'll talk about now. If you've read any astrotrading books (mine included) you'll find that the emphasis is almost overwhelmingly on trying to use astro to locate turning points. That works, and is definitely one way to approach the subject, but there are other ways to use this information, and I think the desire for being able to call tops and bottoms really blinds astro researchers at times. I know that definitely happened to me in my early years working with this stuff.
The other way to approach this field is to think in terms of volatility. In other words, when lots of planets line up in particular configurations, rather than look for a turning point in the market, what about looking for an increase in volatility? Going back to traditional astrology, the birth chart, or natal chart, is like the "antenna" of the individual. When various things happen in the sky to trigger that antenna, then events occur to that person. That's why one person can be having a crappy day, while another one is just going about their business without any issues - that first person is having a bad aspect, while the second person has a different natal chart, and isn't absorbing any of that energy.
Anyway, back at the beginning of this thread, we looked at three different planetary wheels from the ephemeris: 1) the natal chart, 2) the progressed chart, and 3) the current (or "transiting") planets. The first one is fixed, and is there from birth, the second is the birth chart spun around at a given rate, like a bezel on a watch, and the third is the position of the planets as they appear in the current moment. What we want to do is use this information to tell us when the market will have a big day, and when the market won't. In other words, we're going to build an algorithm that tells us how hard the market's antenna is getting hit.
So first off, let's figure out what the market's birthday is. This is actually kind of a can of worms, since there are multiple answers to this problem. For the S&P, there are four common answers:
1) The first trade date of the big S&P 500: 4/21/1982
2) The first trade date of the actual EMini futures: 9/9/1997
3) The birth of the NYSE itself: 5/17/1792
4) The corporate reorganization of the NYSE: 2/18/1971
Those of you who have used some of the astro tools in W59 might recognize some of these dates, especially the first one. I haven't gone through the entire list of possibilities, but just jumped right to the third one with this system. Back in 1792, a number or stock brokers got together and agreed upon how the NYSE would function. This was considered the first meeting of the organization, and is known as the Buttonwood agreement, singed by 24 brokers under a buttonwood tree, on Wall St. There are different times that this is thought to have happened, and a quick Google search should give you a few. Jack Gillen says 8:52 AM, Eastern Time, which is the one I chose in the functions. I'm not sure who's right, but we have an optimizer, so we can actually do some solving ourselves for this later.
Now that we've got the date, we can look at our three wheels, which give us three possible solutions:
1) Current Planets vs Natal Planets
2) Progressed Planets vs Natal Planets
3) Current Planets vs Progressed Planets
We can measure "energy" in those three ways, and we do so simply by counting up hits from one wheel to the other. So, for the first option, we start with an index value of 0, and then we look at each planet in turn. If it is within 1 degree of a natal planet, add 1 to our index. Compare all the combinations, and you get an indicator that will give you a higher value when there is more interaction between those two wheels, and a lower value when there is less interaction. I've build functions for all three, which I've included in the attachment to this post.
So that's how we'll measure market weather, which is the last piece of the puzzle. Here's our first script:
Code: Select all
#Trades simple moving average crosses, but only on days with hits
#on Buttonwood chart
#thresh = we have to have this many hits on our chart to get permission to trade
#orb = how many degrees to allow in order to count a hit
#correction = how many days to add or subtract from Jack Gillens 1792 date

input:thresh(3),orb(1),correction(0.25);

#init variables - this block only happens once at the beginning
if (barnum==barsback)
{

    signal = 0;
    bs = 0;
    ok_to_trade=false;
}

#market weather computation ----------------------------------

#index=Buttonwood_Index_CurrentToNatal(orb,correction);
#index=Buttonwood_Index_CurrentToProgressed(orb,correction);
index=Buttonwood_Index_ProgressedToNatal(orb,correction);

ok=false;
if (index>=thresh) ok=true;


#compute trading signal --------------------------------------

signal = Buttonwood_Signal(8,34);

#actually place trades ---------------------------------------
if (ok==true) {
    if ((signal>0) and (bs<=0)) {
        buy(1,close,"market","onebar");
        bs=1;
    }
    if ((signal<0) and (bs>=0)) {
        sell(1,close,"market","onebar");
        bs=-1;
    }
}
else {
    if (bs!=0) {
        exitlong(0,close,"market","onebar");
        exitshort(0,close,"market","onebar");
        bs=0;
    }
}

#end of day exit
if (time==endtime) {
    exitlong(0,close,"market","onebar");
    exitshort(0,close,"market","onebar");
    bs=0;
}
I've tried to keep this code as clean as possible, knowing that some of you will want to get in there and poke around. If you ever get confused about what I was doing in a particular section, please ask! Note that I've got three different functions for market weather, since I wanted to provide everything, but we are only using the last one. That's because I ran a test on each, and got the following results, from 1/1/2009 through 10/15/2015:
Raw (no filters): $11.69 average trade
Current To Natal: $19.65 average trade
Current to Progressed: $8.65 average trade
Progressed to Natal: $28.19 average trade
Only Progressed-to-Natal gets us close to our breakeven point, although Current-to-Natal makes an argument for more investigation. Current-to-Progressed was horrible, even worse then no filter at all. That might mean we need to trade when Current-to-Progressed is low, rather than high.
I'm putting that in red! Someone check it out!
When you go through the index functions, also note that I've only considered "hits" when one planet is either conjunct (same degree), or opposed (180 degrees) away. That might not be the only appropriate configuration, and most astro finance types would argue for more aspects to be added. That's another one to take a look at as we build this out.
Let me take a minute and talk about the "correction" input. Since we don't know whether Jack Gillen's time was correct, that input lets us move our natal date forward and backward by a fraction of a day. So an input of "1" would push the entire natal date forward to the exact same time on the very next day. I ran a quick optimization report, and found the following results:
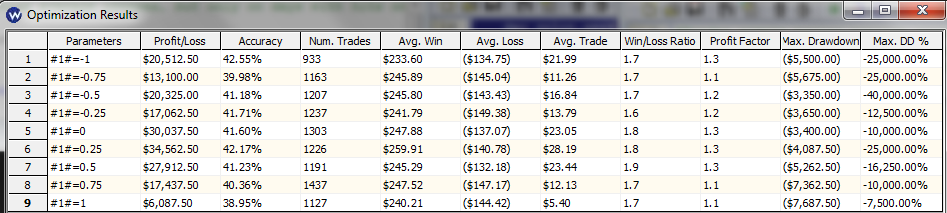
- Rectifying the Buttonwood Natal
- optimizing_buttonwood_filter.png (62.96 KiB) Viewed 27173 times
Note that a much better natal than Jack's is actually a quarter of a day later, using the value of 0.25. This needs to be fine tuned more than I've done, but I think I'm pretty close.
Anyway, here's the full system report right now:
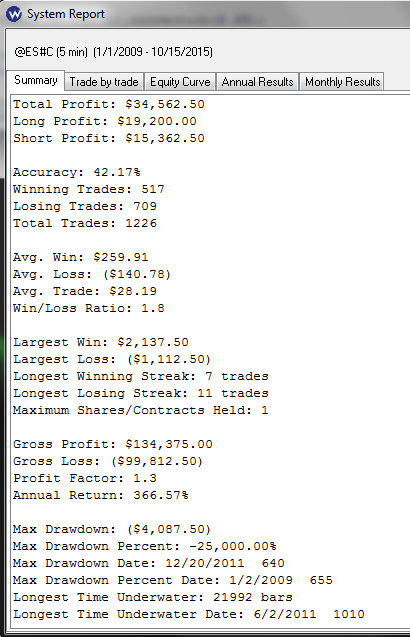
- System Report for Buttonwood_v1
- system_report_v1.png (31.89 KiB) Viewed 27173 times
Not quite awesome just yet, but it's at least to break even, and is a huge improvement over the original in that regard. Keep in mind that the system we are using here is just 8/34 moving average crossovers, which is not exactly the pinnacle of technical analysis.

We are just trying to find those days when the market likes to trend, and we are definitely making some strides in that direction if we are able to eke out even small profits using a simple moving average crossover system.
Here's the equity curve:
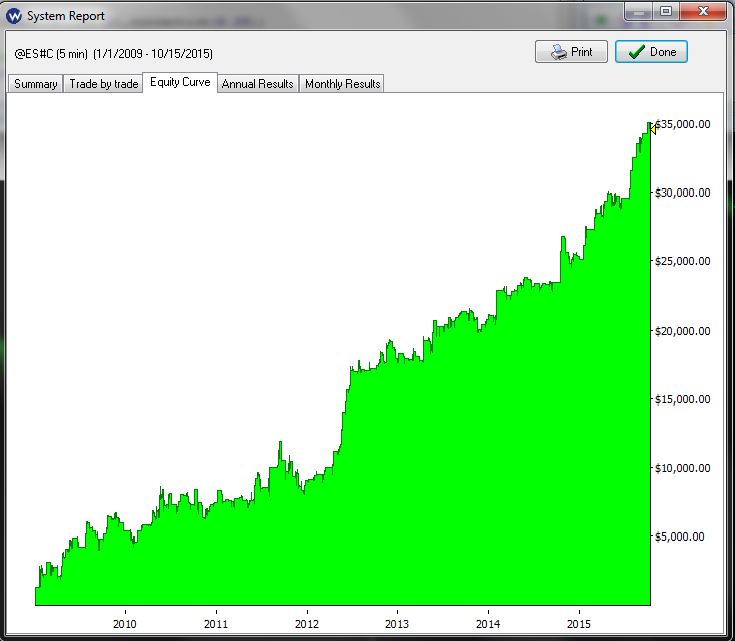
- Equity Curve for Buttonwood_v1
- equity_v1.png (33.17 KiB) Viewed 27173 times
I actually look at the equity curve plot first, before anything else, and think it is the most important piece of a system report. This one is looking very promising.
So, there you have it. Our first version. Lots of work to do still. To be thorough, I'm going to add some red items, which hopefully some of you will be willing to follow up on as part of this project:
Possible Improvements:
1) What is the best "correction" setting? Optimizing between -1 and 1 in small steps is the way to find that.
2) Is there a better natal date than the Buttonwood agreement that we should be using instead? How do the other 3 look?
3) We only consider conjunctions and oppositions. What about other aspects, like squares (90 and 270) or trines (120 or 240). Do they have a polarity? In other words, do all aspects add volatility, or do some reduce it? If we have reducers, we need to subtract them from the index rather than add.
4) What's up with current-to-progressed giving us worse results than the raw system? Sounds like a volatility-reducer to me! Significant enough to work in?
5) After all of that is figured out, we need to find the correct "thresh" value, which tells us what the index needs to be in order to allow us to trade.
All for now. One last point, I'm using IQFeed's @ES#C symbol, which they'll give you going back pretty far. I started in 1/1/2009, which gives us almost 8 years to test on. 2008 also works, but it tends to skew results a little, since there was too much money to be made that year. You can use it or not, but I think 8 years is plenty for an intraday system like this. 1226 trades is putting us in the "statistically significant" arena, at least in my experience. To download the scripts, just get the zip file (attached), unzip, then double-click and W59 will handle the rest.
All for now!
Earik