Page 1 of 1
just sayin', part 2
Posted: Tue Aug 28, 2018 11:35 pm
by abacaba
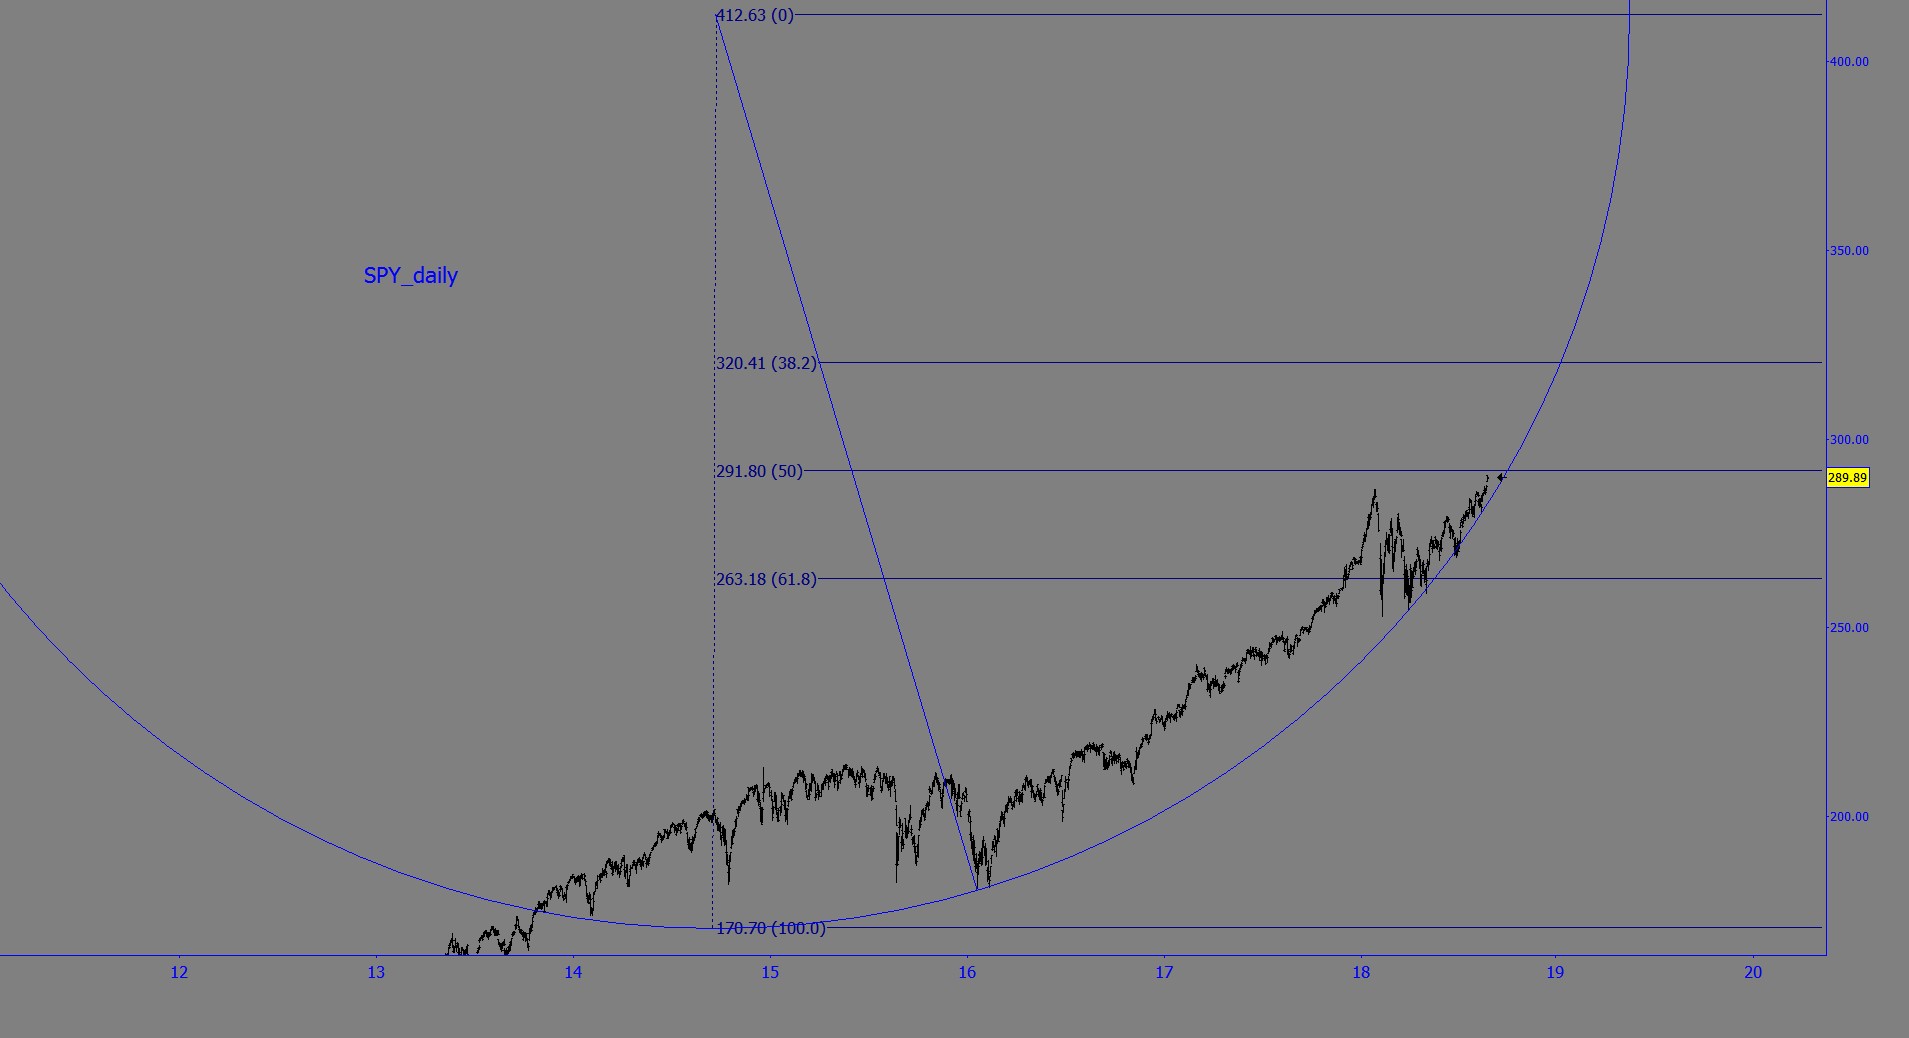
- SPY_daily.jpg (86.12 KiB) Viewed 10501 times
Re: just sayin', part 2
Posted: Thu Aug 30, 2018 6:39 pm
by earik
I hear you... The farther it crawls up that circle, the worse the break will be when it happens.
Re: just sayin', part 2
Posted: Fri Aug 31, 2018 12:42 am
by abacaba
Earik,
Yes. I remember coming across the circle as a chart tool in Michael Jenkins' work years ago. And a few of us posted related topics on the old W59 forum.
I've kept Jenkins larger concerns, but added systematic protocols for circle placement that allow for an x,y axis overlay that projects S/R. I use the model now and then on larger time frames to project and confirm changes of state during periods of disequilibrium such as now. It works very well. Since my post on the 8.28.18, the market uptrend stopped on the 29th at 291.74 (per IB), 6 cents below the projected R @ 291.80, not too bad, and sold off today. That's step one of a two-step model. The next confirming step would be (a) R price holding along with (b) price breaking out of the circle. That's the large view. My original "just sayin" post shows this just as price was about to break.
Of course, stuff like this would not be possible without Wave 59's chart scaling capabilities

!
Todd