Page 3 of 4
Re: Energy Trading - July 22
Posted: Mon Aug 31, 2015 11:18 pm
by earik
Hi Dave,
If you see the data flowing in the panel like that, it means you are connected properly. Errors, etc, will be shown on the other side, but the L1 Socket: OK means that you're good. There's a bug in the downloader that results in a situation where you can't see symbols. Just close out of that, then go to the main IQCollector window and click File - Data Folder, note the location, then change it to some other path (doesn't matter what), and click OK. Then go back, and change it to the original value, and the downloader should now function properly.
Overlays are a good idea. Let me get all the bugs worked out, and then I can implement something like that. I'm getting tired of having to reference two charts myself...

Regards,
Earik
Re: Energy Trading - July 22
Posted: Tue Sep 01, 2015 10:50 pm
by soldado1976
I am having a problem where I am able to download all the history for, say, today, and yet when I go to open a chart and I have it on the IQCollector feed, I am only getting one bar of data -- setting seem to be correct - any idea?
Re: Energy Trading - July 22
Posted: Wed Sep 02, 2015 6:27 pm
by earik
Hi,
Two things to check:
1) Go to Wave59 and click File - Data Source. "IQCollector" is checked, right?
2) Manually navigate to c:\users\Billy\Documents\Wave59\data\IQCollector\@ESU15. Do you see a \minute folder there, and inside that, do you see a bunch of data files?
If both of those check out, please open a support ticket (
www.wave59.com/support) and we'll continue it there, as it might be a more involved issue...
Regards,
Earik
Re: Energy Trading - July 22
Posted: Thu Sep 03, 2015 10:35 pm
by daveobrien
Good news Earik !
Just *tested * the data collector and I have been able to download historic tick data for 4 weeks for the ES [ more days may be available but quite boring adding one day at a time .Might try again later on ]
Cheers
Dave
UK
Re: Energy Trading - July 22
Posted: Fri Sep 04, 2015 12:15 am
by Feinberg
Hello Earik,
There appears to be a difference between the two types of Time Bars.
I like the new IQ Collector display. I am not sure how the IQCollector bars are assembled / calculated / constructed with respect to volume, but there is a difference.
You can see that the display of the indicator, which is volume based, shows a slightly different pattern.
Perhaps you can give us some insight on your new IQCollector and how the module massages / differentiates / builds this new data of Bids and Asking volume.
Thanks!
Great job on this.

Joseph
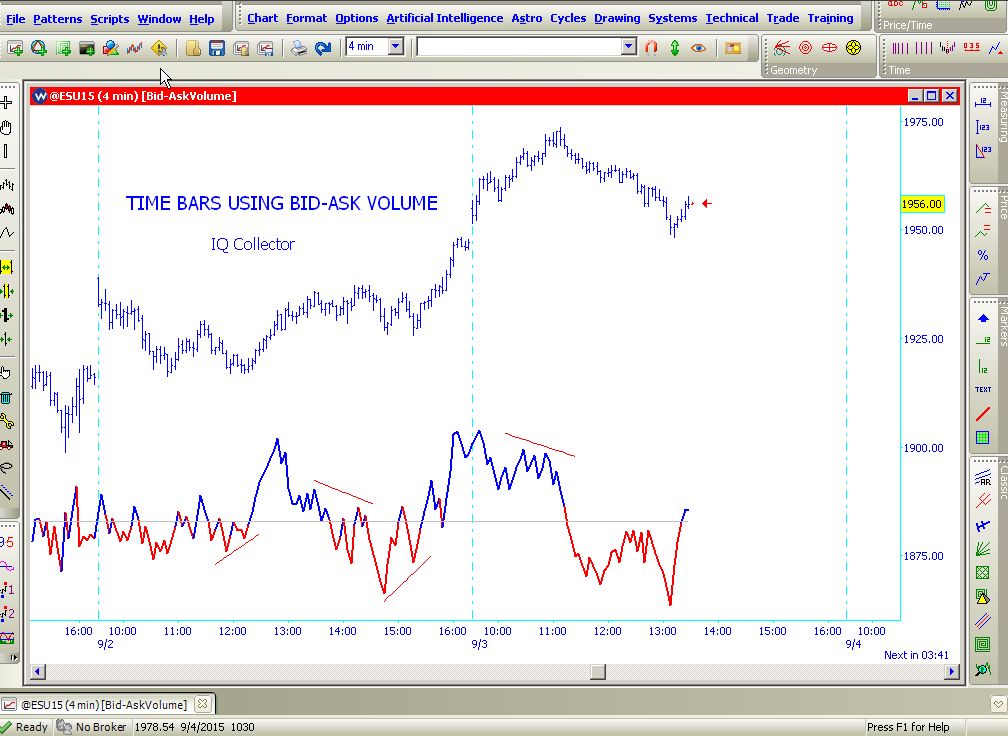
- TimeBars_Bid-Ask_150903a.jpg (123.82 KiB) Viewed 11274 times
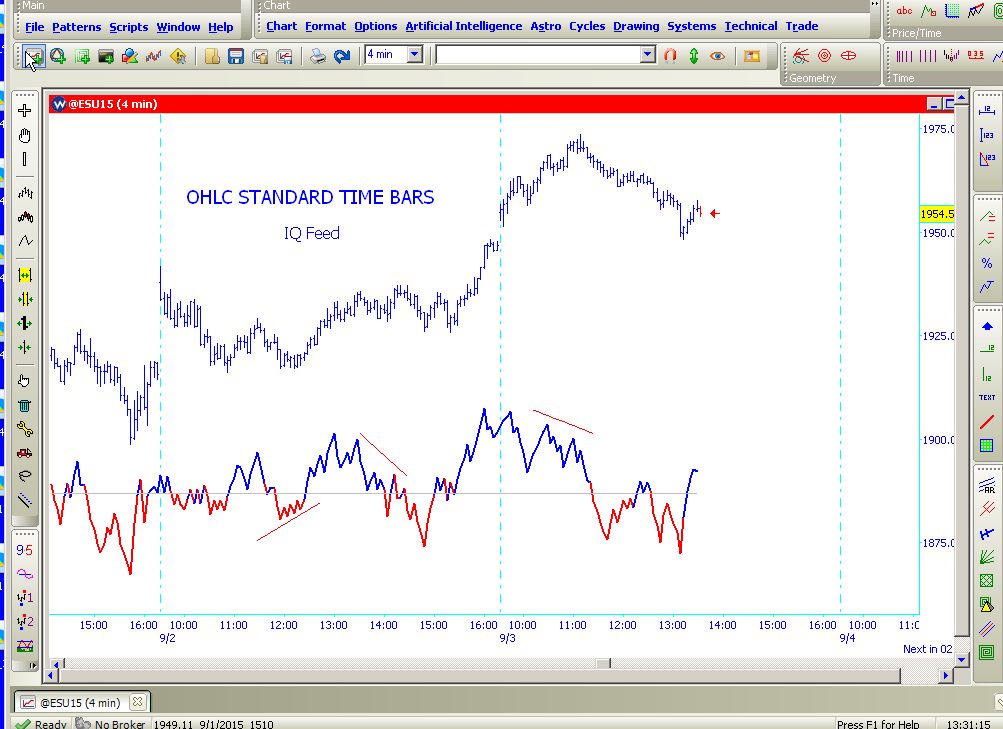
- TimeBars_OHLC_150903b.jpg (123.89 KiB) Viewed 11274 times
Re: Energy Trading - July 22
Posted: Sat Nov 14, 2015 2:16 pm
by Feinberg
Hello Earik,
How do you interpret this divergence?
Prices made a high on 11/3 (red arrow) and the corresponding level (red arrow) with the Energy Bars.
But on 11/11 (blue arrow) the Energy Bars diverged from price considerably.
What were the Energy Bars telling us?
I would have expected both series, in this case, to be in tandem.
What are your thoughts?
Joseph
Re: Energy Trading - July 22
Posted: Wed Dec 02, 2015 11:07 am
by Feinberg
Earik,
We can all see these divergences where the arrows are, this is expected.
But where the rectangles are the Cumulative Volume is no way near the market High.
Joseph
Re: Energy Trading - July 22
Posted: Sat Dec 12, 2015 8:26 pm
by Feinberg
Here is something that I am really confused about. What does this mean?
Around 12:30 or so, the Cumulative Volume begins to ascend? And the Cumulative Volume is rising when the market is going down?
From around 12:30 to the close there are about 400,000 contracts, and the Cumulative Volume goes from about 100,000 to about 125,000............or net, about 25,000 more contracts are buying?
"Smart money" is buying?
Not shown are the Energy Bars. This conforms to prices, but not the Cumulative Volume.
Could it be that "smart money" is anticipating a bounce or "a buying opportunity"?
I just do not know how to interpret this discrepancy.
What thoughts do you have on this?
Joseph
PS For future reference, this is Friday, December 11, 2015 when oil prices reach a new low and the equities sell off hard.
Re: Energy Trading - July 22
Posted: Sat Feb 13, 2016 3:47 pm
by Feinberg
Hello Earik,
I am encouraged by this module of the Cumulative Volume and the Energy Bars.
As I understand it, you are doing your best to corrects its errors.
In the meantime, I wanted to post this chart. On the ES, prices made a low on February 11th, but the Cumulative Volume did not confirm it.
Currently, I try to look at this module not for intra-day trading but as a guideline as to "what's under the hood" as to the markets behavior.
Joseph
Re: Energy Trading - July 22
Posted: Thu Jul 21, 2016 1:31 am
by Feinberg
Here we have an all time high in the e-mini futures and look at the Cumulative Volume (right)........it, Cumulative Volume, is not even close to price confirmation.
Compare the price and volume high on July 13th................now look at it today.
Go figure!
Joseph
PS 4minute 24/7 chart.