Post Market Review...
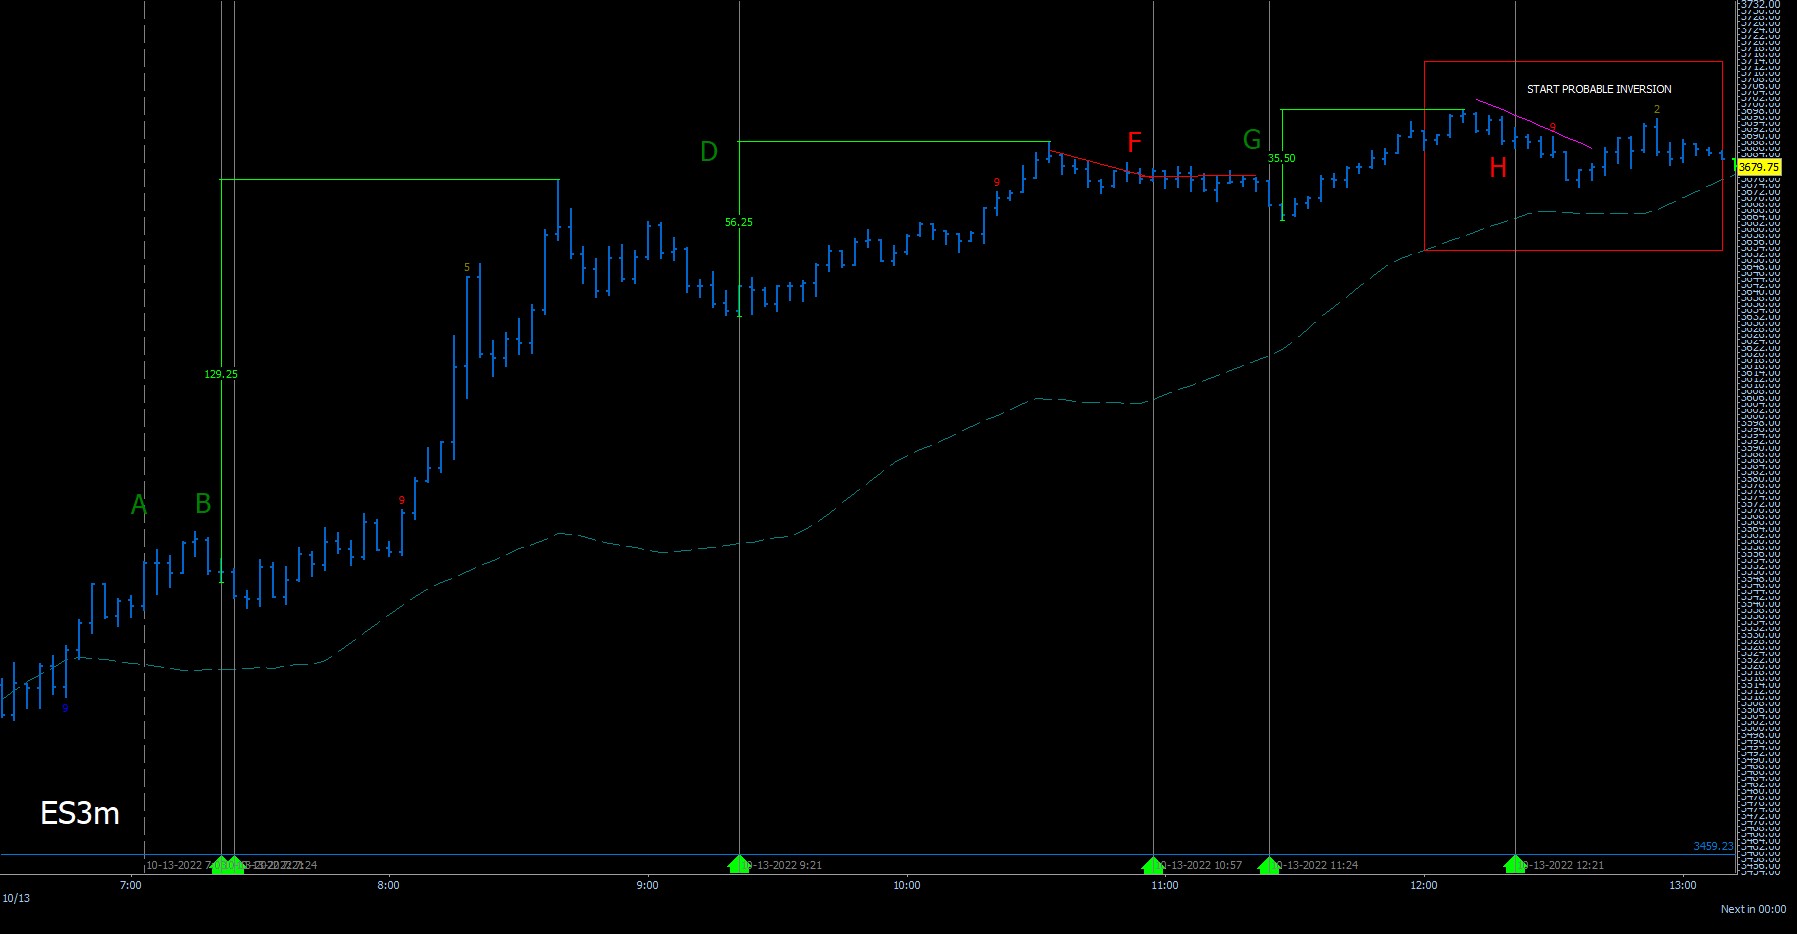
- crsp1013a.jpg (120.12 KiB) Viewed 26715 times
Point A an experimental point that was only marked with a line. No green arrow marked yesterday but seems very promising.
Point B had a pair of CITs effecting a 129 point run.
Point D CIT reverses the consolidation. Bull flag says the imagination.
Point F is a failure to reverse as it merely stops the downward movement shown in red trendlines.
Point G shows a nice run, off by a bar.
Point H also fails as a CIT and the NF plot seems to reverse.
The NF plot (dashed teal) is calibrated for positive price action.
But what about the Points C and E? The follow up chart for your consideration.
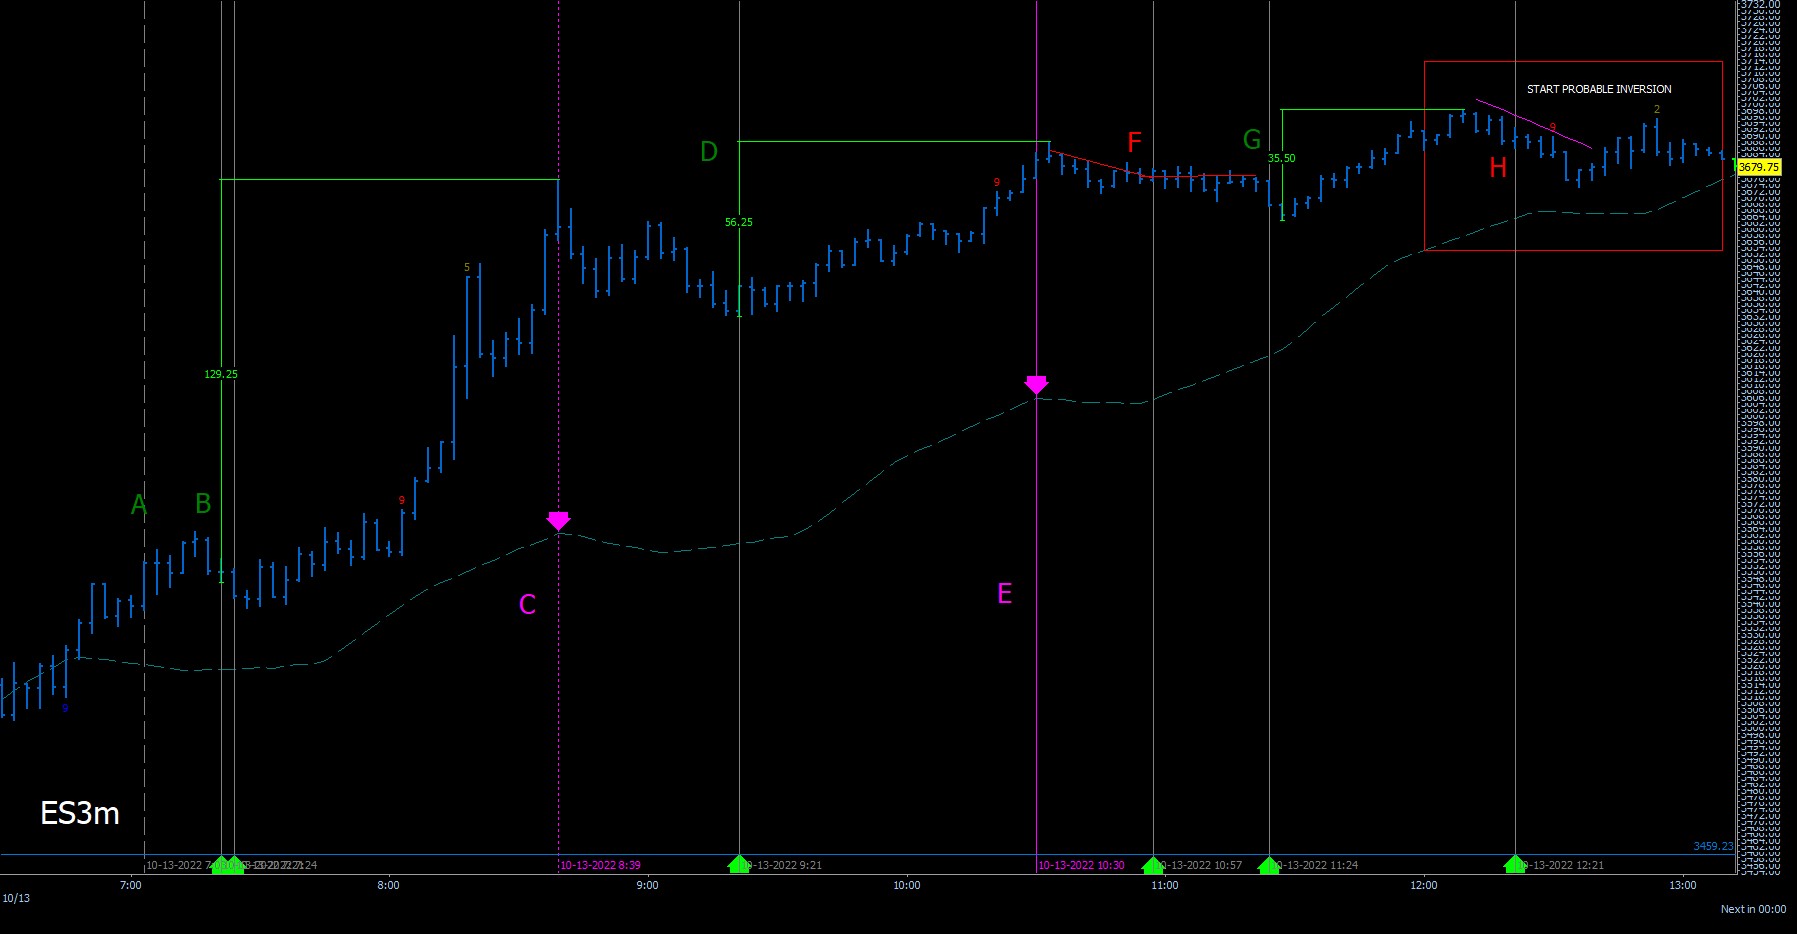
- crsp1013b.jpg (130.39 KiB) Viewed 26715 times
We can derive the C and E lines looking at the NF's for CIT reversing plots. There could be countertrend/energy trades C to D and E to F.
All forecasting was performed on a stock platform without upgrades and/or custom indicators.
This is what we do.