GEMGP

This is a forum to discuss trading tools and approaches to timing the market.
User avatar
ForJL
Posts: 280
Joined: Tue Jul 21, 2015 11:06 pm
Contact:

Re: GEMGP

Post by ForJL » Mon Jan 04, 2016 9:59 pm

As I look to expand the potential of GEMPG I thought I would try to adapt it to the Planet Rise Harmonic indicator in W59. I have only been using it for a short while but thus far like the results. If you would like to recreate the results below use the following settings:
Bands_1
Error_20
Exchange_MagneticSouth 1987
Smoothing_8
Interpretation is simple … look for a possible CIT when indicator peaks when equal to or greater than 8. The second indicator is the PRH using default settings and is shown for comparison.

Joe
PRH_010416.png
PRH_010416.png (26 KiB) Viewed 9638 times

User avatar
ForJL
Posts: 280
Joined: Tue Jul 21, 2015 11:06 pm
Contact:

Re: GEMGP

Post by ForJL » Tue Jan 05, 2016 9:32 am

Let's watch the rest of the day together. There are 3 CIT signals left but no guarantees implied or given. ;)
PRH_010516.png
PRH_010516.png (22.77 KiB) Viewed 9631 times

User avatar
ForJL
Posts: 280
Joined: Tue Jul 21, 2015 11:06 pm
Contact:

Re: GEMGP

Post by ForJL » Wed Jan 06, 2016 12:06 am

A quick follow up to this morning post shows that the forecasted CIT’s did quite well and are depicted in the first chart below by the large red arrows. The first two called nice rallies while the third was not nearly as good but tradeable nonetheless. The second chart shows some of the other techniques that I have written about and we can see how two unrelated approaches both gave the same general areas to look for changes in trend. If you look closely in the second chart you will notice that Flux S/R is sloppy before 02:00 and that is because the harmonic fractal of price had changed from 408/73 to 408/112. After 02:00 things tighten up quite nicely. Finally while not the thrust of this morning’s post but consistent with the overall thread we see that the Modified Exchange Cycle Forecast in the first chart inverted soon after posting. This inversion continued though 16:00 where we flip again back to a normal forecast. Green lines are base inverted, red inverted, light blue base normal, and blue normal. If anyone has any questions just give a holler.

Best,
Joe
PRH_010516_update.png
PRH_010516_update.png (24.84 KiB) Viewed 9613 times
Flux_010516.png
Flux_010516.png (45.34 KiB) Viewed 9613 times

User avatar
ForJL
Posts: 280
Joined: Tue Jul 21, 2015 11:06 pm
Contact:

Re: GEMGP

Post by ForJL » Wed Jan 06, 2016 9:21 am

I have to admit I got a big kick out of seeing this this morning because I wasn't keying in on the signal at 19:28 last night at all. Very gratifying indeed.
Out of the office most of the day but again if there are any questions just let me know.

Joe
PRH_010616.png
PRH_010616.png (19.4 KiB) Viewed 9607 times

User avatar
ForJL
Posts: 280
Joined: Tue Jul 21, 2015 11:06 pm
Contact:

Re: GEMGP

Post by ForJL » Thu Mar 03, 2016 7:34 pm

It’s pretty quiet around here again so thought I wound show you guys another example of this kind of work but on a larger scale. Here we are looking at a Weekly GC chart. The basic principles remain the same though there are some differences. I believe the chart speaks for itself and shows what you can accomplish when you get all the harmonics correct.
For clarification I kept the first chart clear of clutter and used the second chart to show the actual planetary degree lines which were H_Mars.

Joe
Wkly_GC_FluxWO.png
Wkly_GC_FluxWO.png (45.3 KiB) Viewed 9553 times
Wkly_GC_FluxW.png
Wkly_GC_FluxW.png (59.8 KiB) Viewed 9553 times

Simon.B
Posts: 91
Joined: Thu Jul 23, 2015 8:26 pm
Contact:

Re: GEMGP

Post by Simon.B » Fri Mar 04, 2016 1:46 am

Hi Joe,

Thanks for the charts. Wanted to ask you how do you determine points above price data from which angles run down ?
Sorry in advance if you explained it before and I just missed it.

Simon

User avatar
ForJL
Posts: 280
Joined: Tue Jul 21, 2015 11:06 pm
Contact:

Re: GEMGP

Post by ForJL » Sun Mar 06, 2016 4:52 pm

Hi Simon,

Sorry about the late response but was out of town when I saw your post and then simply forgot about it after I returned. Guess the old memory isn’t what it used to be. :)
Yes, I have answered this question before but only in the vaguest of ways because it is part of what I consider proprietary work. The GC chart above actually relates more to Energy Flow then GEMGP but I kept it in this thread because the approach of the three indicators was the same and didn’t want to complicate things any more then they probably are for a lot of people who read these posts of mine.
Very broadly speaking, and with the emphasis on very, time, price, and harmonics, are all woven together with both Energy Flow and GEMPG which are conceptually similar. In other words harmonics of time and harmonics of price are very similar though not as exact as one might think. In fact it is my belief that if you approach this kind of work thinking that you are going to find these very precise relationships that you are on a fool’s errand. That is not to say that exact relationships don’t exist or happen, they do, but they are transitory and don’t last forever. There will be times where harmonic relationships appear to last for extended periods of time but it all depends on the energy signature under observation. Eventually they will all change and in many cases, especially within GEMGP (hint) repeat somewhere down the line. It should be noted that GEMGP looks at much smaller energy signatures, timeframes, and harmonics then does its Energy Flow counterpart. To complicate things even further there will be times that you will have multiple solutions that are mathematically correct but only one will be right. Yeah, I know … what is he talking about now, right?
I know none of this probably helps you with your question but it’s really the best I can do. If you want to mess around with this stuff below is a chart with the settings for the flux lines to perhaps get you started. Key in on harmonics, both time and price, and don’t get to hung up on exact relationships as they need not be. Why they don’t is another subject unto itself.
By the way, try turning “Link to Ascendant” on and off and see what happens. ;)

All the best,
Joe
Wkly_GC_FluxFSet.png
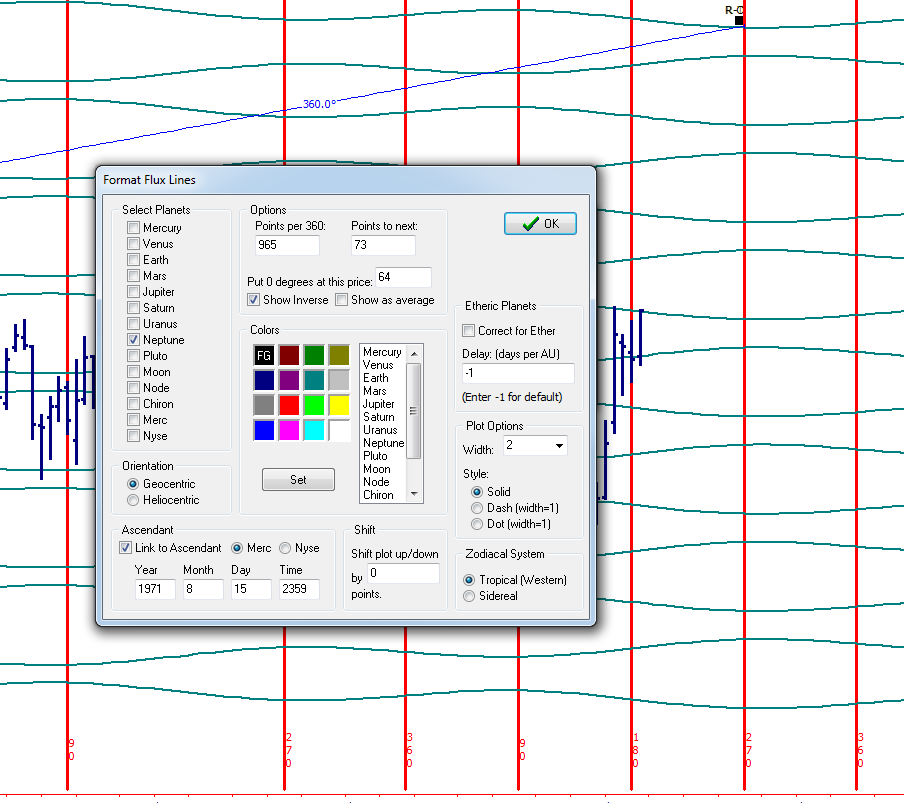
Wkly_GC_FluxFSet.png (61.56 KiB) Viewed 9527 times

User avatar
ForJL
Posts: 280
Joined: Tue Jul 21, 2015 11:06 pm
Contact:

Re: GEMGP

Post by ForJL » Tue Mar 08, 2016 12:41 am

A very quick example of how things went today on an intraday basis in the YM. We had a nice tight “area of confluence” for the open that consisted of only 3 bars. In those 3 bars we actually are getting 4 signals … one each off of the measured TTN (Transit to Natal) signals, and one off the aspects. There were a lot of things that were going on here like price containment through Flux lines and an old fashioned Double Bottom among others that screamed rally and in a big way. The second signal in the afternoon wasn’t as tight and we also had a bad signal at @12:00 that we had to deal with. I actually nibbled on that and took a loss of 2 ticks plus commissions. I was however sitting chilly at @13:00 for the sell and more than made up for the loss. Note also how the Flux line indicator catches all the major tops and bottoms with near perfection.
If you are trying to replicate this kind of work I again suggest you look at your dates and by that I mean historically significant dates. Next, build a library of these dates and look for relationships among them. All of the indicators you see here are using harmonically related dates. Not necessarily the same date, but they could be. Work out the harmonics of the dates and you should be able to work out the harmonics of price … and visa-versa. Though I prefer to work with dates first. Additionally, as I said yesterday, don’t get hung up about trying to be exact … you don’t have to be.

Joe
YM_030716.png
YM_030716.png (28.69 KiB) Viewed 9508 times

Simon.B
Posts: 91
Joined: Thu Jul 23, 2015 8:26 pm
Contact:

Re: GEMGP

Post by Simon.B » Tue Mar 08, 2016 12:52 pm

Thanks Joe, I saw what looked like transiting labels, but wasn't sure. Also figured that there was more to it.

Simon

User avatar
ForJL
Posts: 280
Joined: Tue Jul 21, 2015 11:06 pm
Contact:

Re: GEMGP

Post by ForJL » Sat Mar 12, 2016 9:51 pm

We have moved into a new energy signature that should hold through @ 03/23/16. For those of you who are trying to replicate this work key in on the years 1971 and 1987. Take a close look at Neptune and work in the 4th harmonic (very important).

Good luck,
Joe

YM_NewEngSig0312.png
YM_NewEngSig0312.png (43.46 KiB) Viewed 9484 times

Post Reply

Who is online

Users browsing this forum: No registered users and 7 guests