This is a forum to discuss trading tools and approaches to timing the market.
-
ForJL
- Posts: 280
- Joined: Tue Jul 21, 2015 11:06 pm
-
Contact:
Post
by ForJL » Wed Oct 07, 2015 9:22 am
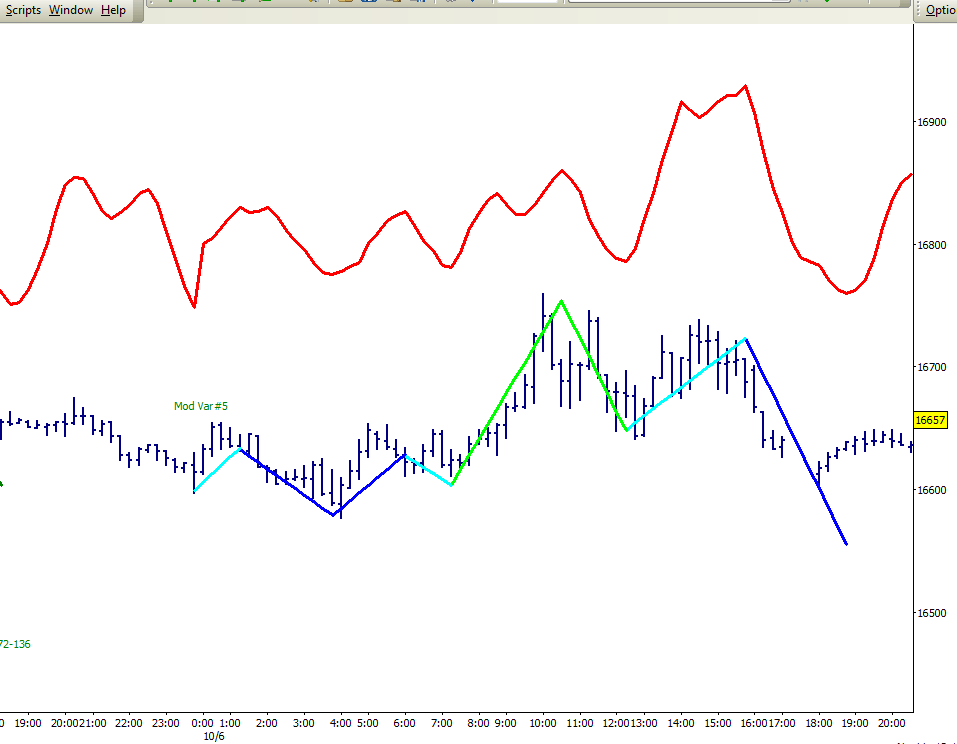
Over the past 10 years or so my work has clearly shown that the measured “flow” of what I like to call astro generated energy has very specific harmonics when measured correctly. Further, once we correctly identify the harmonic of the flow of energy we can then use that information when working with geometric patterns. The first thing the user must do of course is identify and define the energy signature. This is a complex procedure in part because there are two different classes of energy you have to deal with. The first is what I call transient energy, or energy signatures that come and go and are fractal in nature. These work well in price prediction forecasts such as in Natal Forecasts, my own Energy Flow, and the MECF shown in the first chart below. Identify the harmonics correctly, use it for scaling purposes and you can end up with an extremely accurate forecast like the one you see here. Before you can identify the harmonics you must first identify the signature itself. They have a beginning and an end and change often as does their harmonic resonance ergo their definition as transient. The second class of energy is what I call repetitive. As its name implies it is an energy signature that repeats over and over on a regular or semi-regular basis. This type of energy signature lends itself extremely well to geometric patterns. Actually geometric patterns will work well within both energy classes but are much easier to work with using repetitive energy as there is simply less work to do. In the geometric pattern examples below I use both energy classes to help identify trading opportunities.
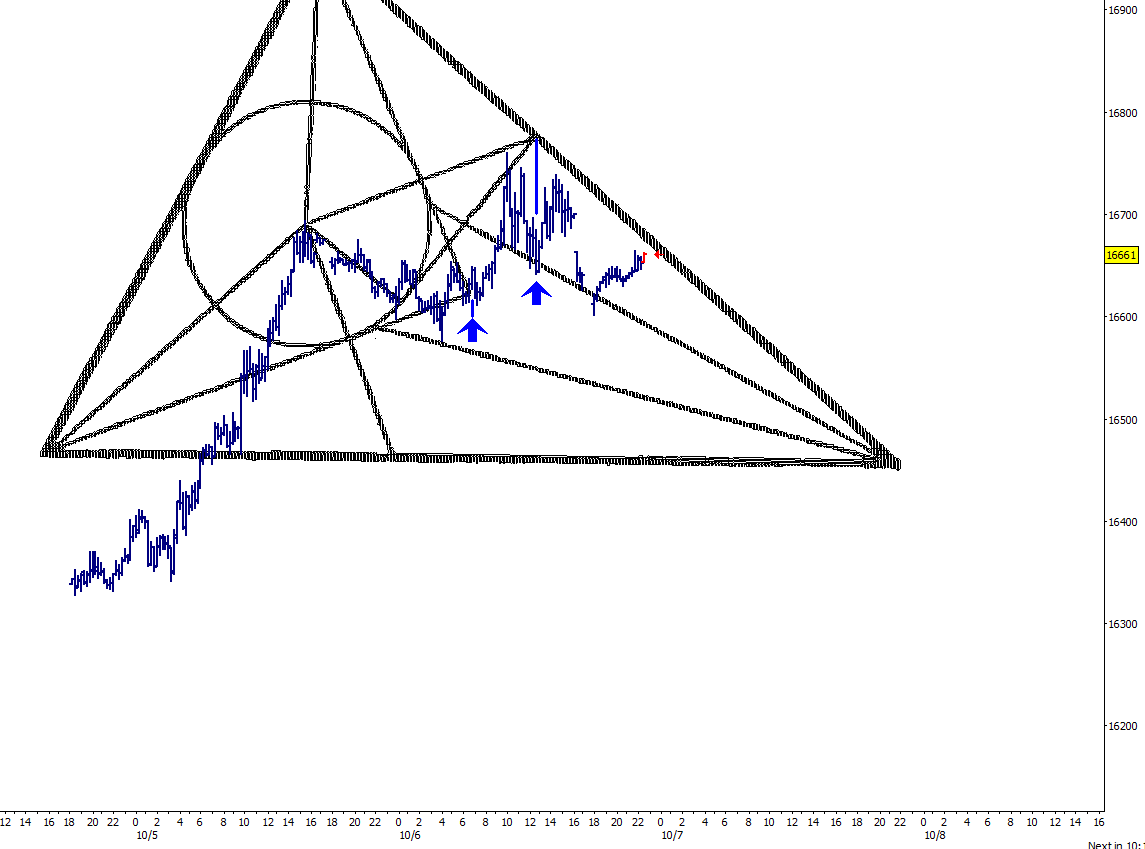
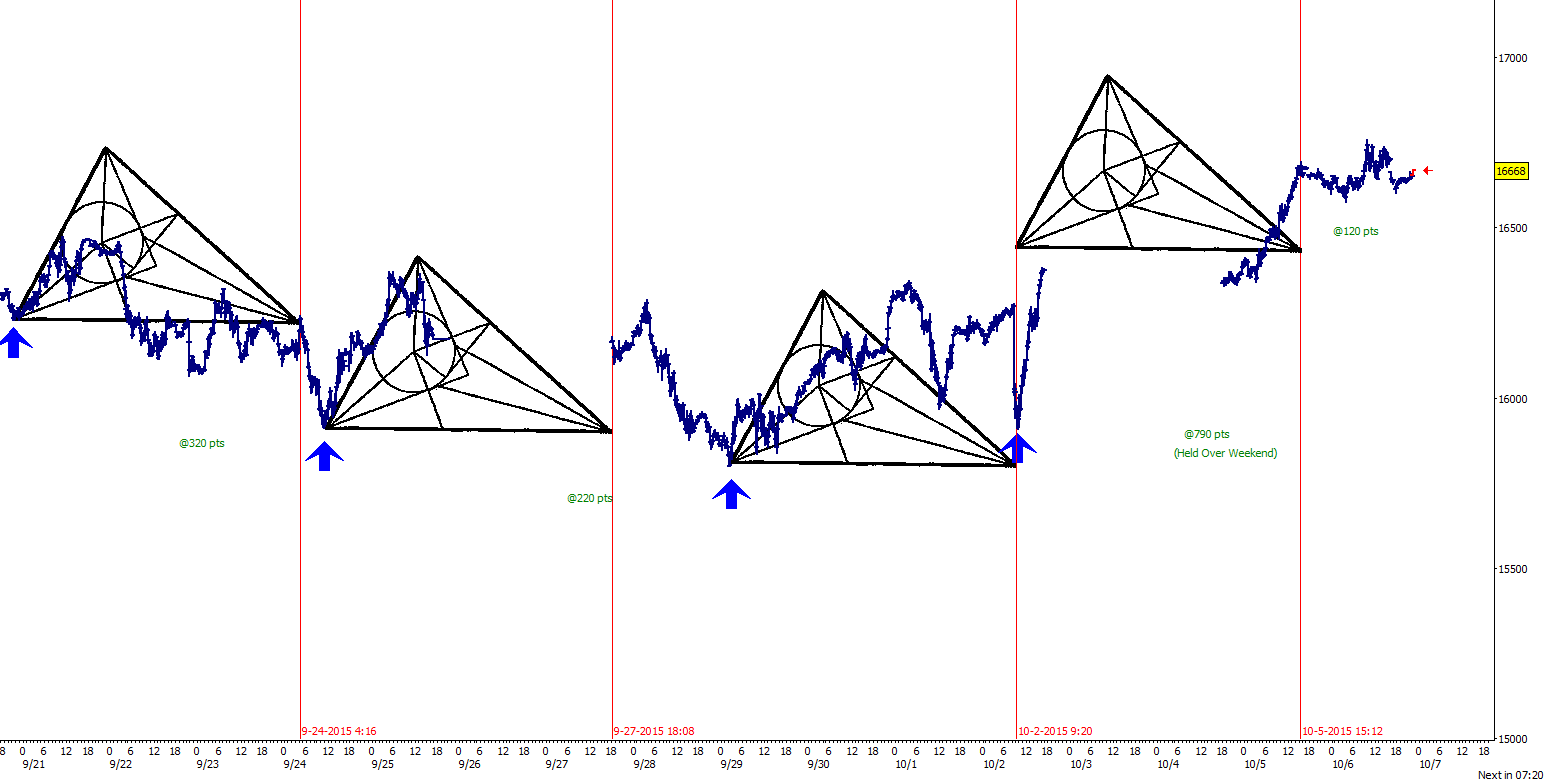
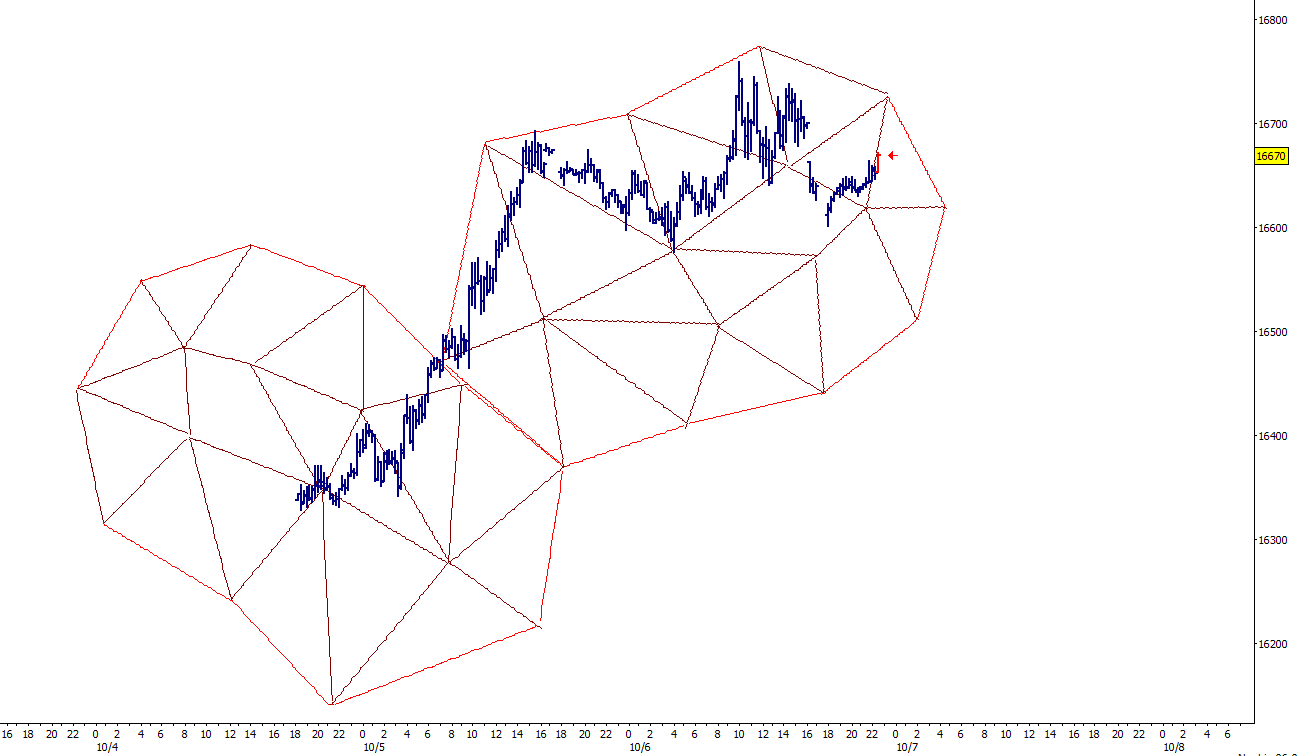
I wanted to show you guys something different today so in the second chart we are going to look at Morley’s Triangle. It is a fascinating pattern and if you’re up for it you should really look into the Morley trisector theorem and the various proofs. This pattern is quite versatile and can be used in a number of ways. Here we are using a transient energy harmonic to properly scale our work. In this example the pattern acts as both a support/resistance tool as well as a timing tool. In the next example using the Morley pattern we are using repetitive energy and the pattern is used strictly as a timing tool. The blue arrows represent energy inflection points and the red vertical lines the resultant CIT. Each instance of the pattern successfully called a market change in trend and as you can see the approximate size of each move is labeled on the chart. In keeping with the “something different” theme the final chart shows a simple “spin network” that is using the same energy harmonic as the previous Morley chart. This pattern is not easy to work with but at times can yield some phenomenal results.
Obviously there are a lot of blanks in this post but as usual it wasn’t meant to be a how to but more of a challenge to your mind and perhaps get you thinking in terms you haven’t done before.
Best,
Joe
- 1_MECF.png (26.4 KiB) Viewed 3700 times
- 2_Morley_T.png (39.65 KiB) Viewed 3700 times
- 3_Morley_R.png (51.72 KiB) Viewed 3700 times
- 4_SpinNetwork.png (35.64 KiB) Viewed 3700 times
Users browsing this forum: No registered users and 83 guests